Rainfall and stream gauge data
Historic rainfall and stream gauge data is used to design stormwater infrastructure for new development and flood relief projects. Many communities have adopted ordinances to require that new developments manage runoff, so flooding is not increased downstream. To accomplish this, detention basins are often constructed to detain runoff and slowly release it. The design standard for a detention facility and outlet structure is commonly expressed as an allowable release rate for a particular design storm.
 |
Design StormsThe allowable discharge from a new development is calculated based on a design storm. Design storms are typically defined by rainfall duration, total rainfall amount, and distribution of rainfall. Rainfall data are used to calculate discharge and thus stormwater infrastructure size for new development. Rainfall intensity-duration estimates are based on statistical analyses of historical rainfall and stream gauge data. A storm sewer system is typically sized for the 10 year design storm. A detention pond is sized for the 100 year design storm. |
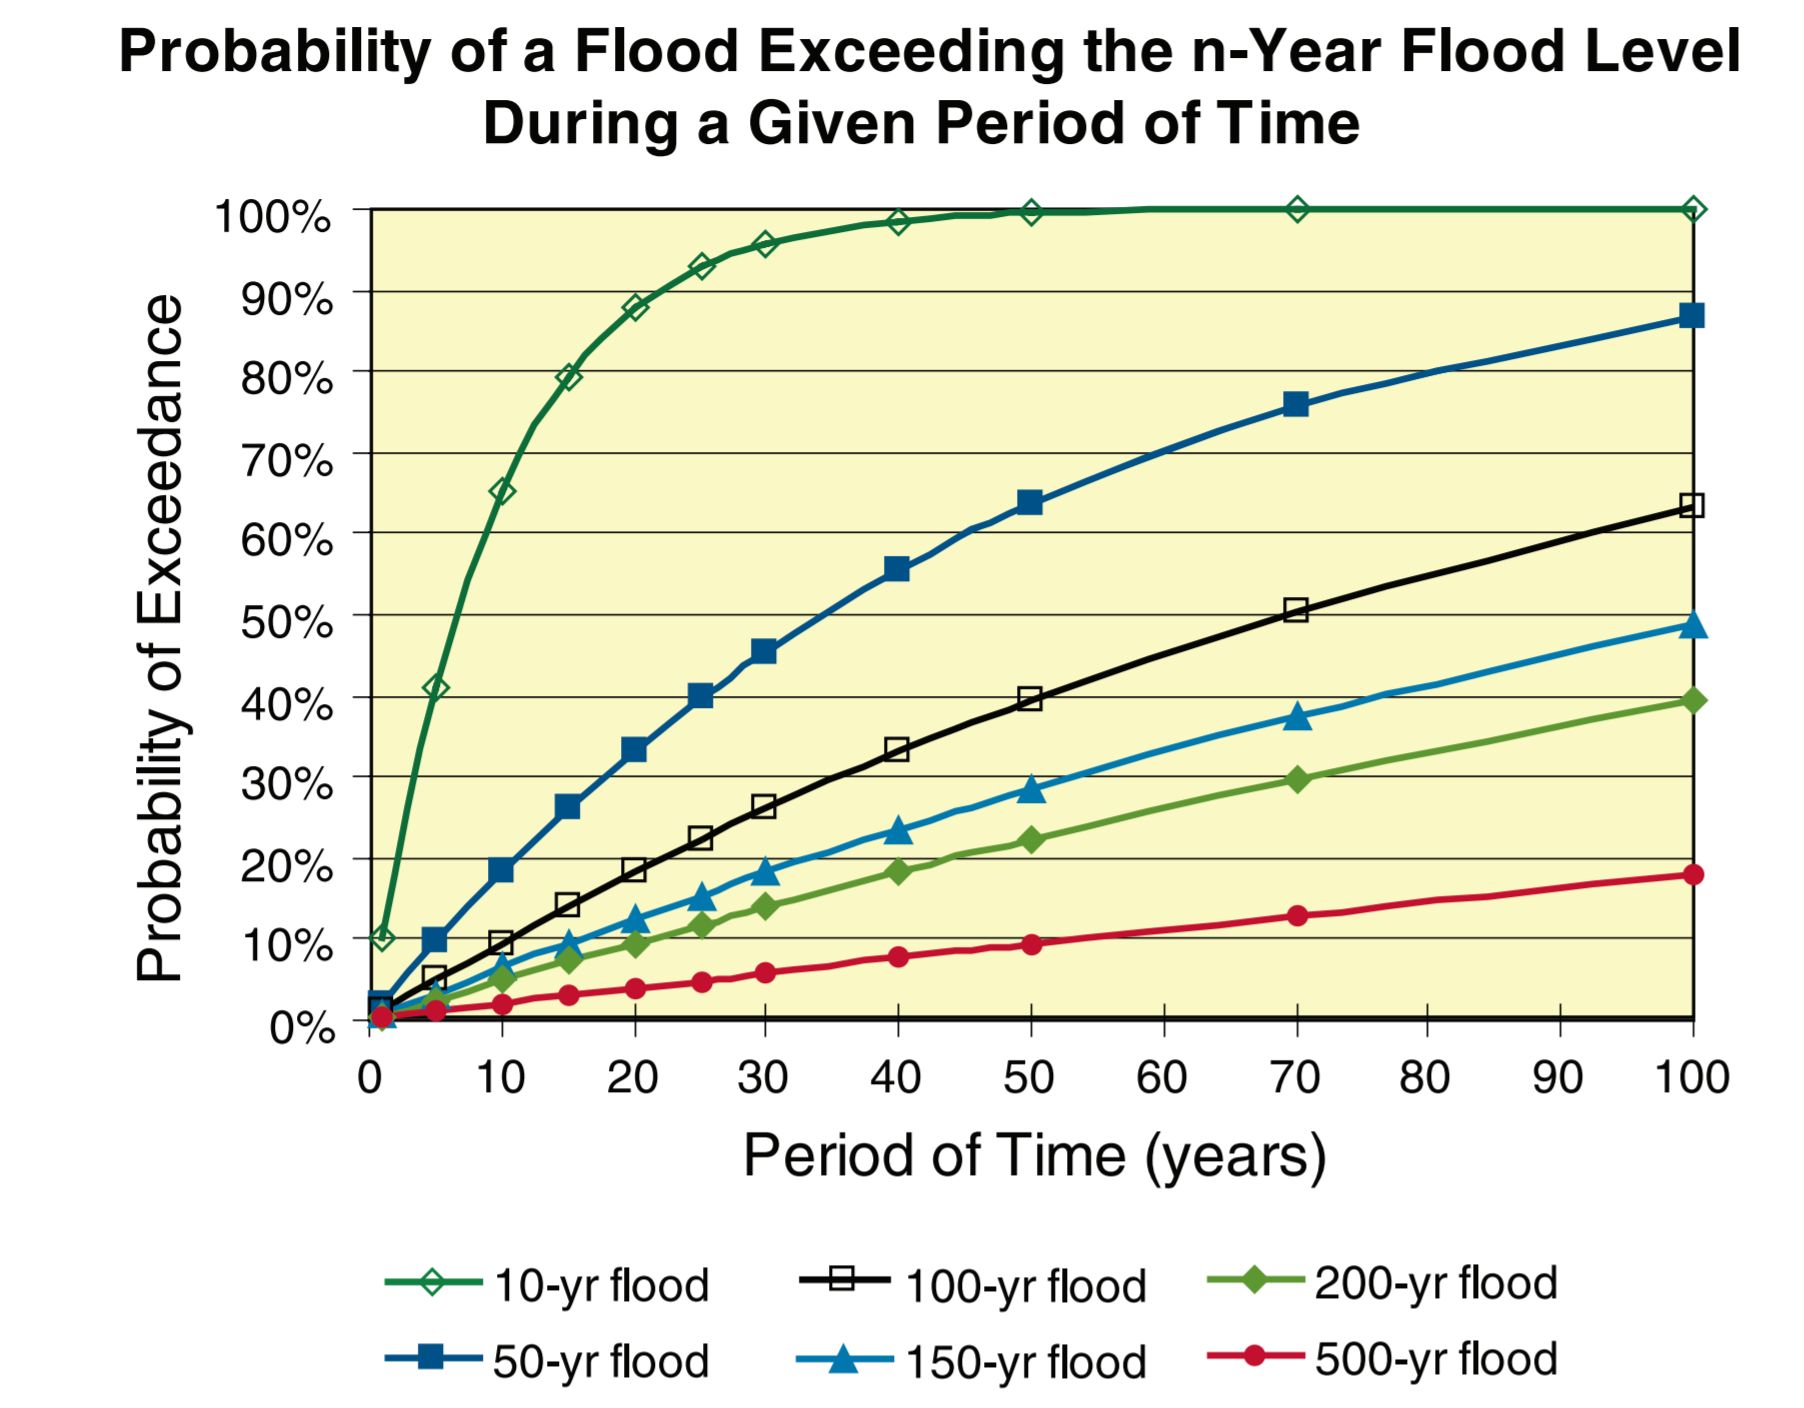
Design Storm Return PeriodThe return period is a way of expressing that the design discharge is expected to be equaled or exceeded on average once in the specified number of years, for example the 10-year rainfall. Based on historical rainfall data, the 10- year rainfall is expected to be equaled or exceeded 1 time in 10 years. This can also be expressed as a probability, such as a 10% annual chance of occurrence, meaning it has a 10% chance of being equaled or exceeded every year. See the USGS website to learn more about design storm return periods in their overview of The 100-Year Flood. |
 |
Rainfall Data
Rainfall data that has been used in Illinois includes:
Bulletin 70: Rainfall intensity and duration estimates from the Illinois State Water Survey’s “Bulletin 70: Frequency Distributions and Hydroclimatic Characteristics of Heavy Rainstorms in Illinois” (Huff and Angel, 1989). The rain gauge records spanned 1901-1983.
Atlas 14: The National Oceanic and Atmospheric Administration’s “Atlas 14: Precipitation-Frequency Atlas of the United States, Volume 2, Version 3.0: Delaware, District of Columbia, Illinois, Indiana, Kentucky, Maryland, New Jersey, North Carolina, Ohio, Pennsylvania, South Carolina, Tennessee, Virginia, West Virginia” (Bonnin et al., 2006). The rain gauge records spanned 1891-2000.
TP-40: This is the earliest published and widely used rainfall intensity duration data was the National Weather Service’s “Technical Paper No. 40, Rainfall Frequency Atlas of the United States” (TP-40) (Hershfield, 1961). The rain gauge records spanned 1938-1957.
Stream Gauge Data
Explore current water conditions that are important to you such as streamflow and water levels in your area. Daily Streamflow Conditions can be found on the U.S. Geological Survey website under USGS Current Water Data for Illinois or NOAA's website River Observations.